Dashboard
See how the business is doing: cash, income, expenses and net income, cash-flow and profit charts, who owes you and recent activity.
The dashboard shows how the business is doing and what changed recently.
Working from the dashboard
- Read the figures
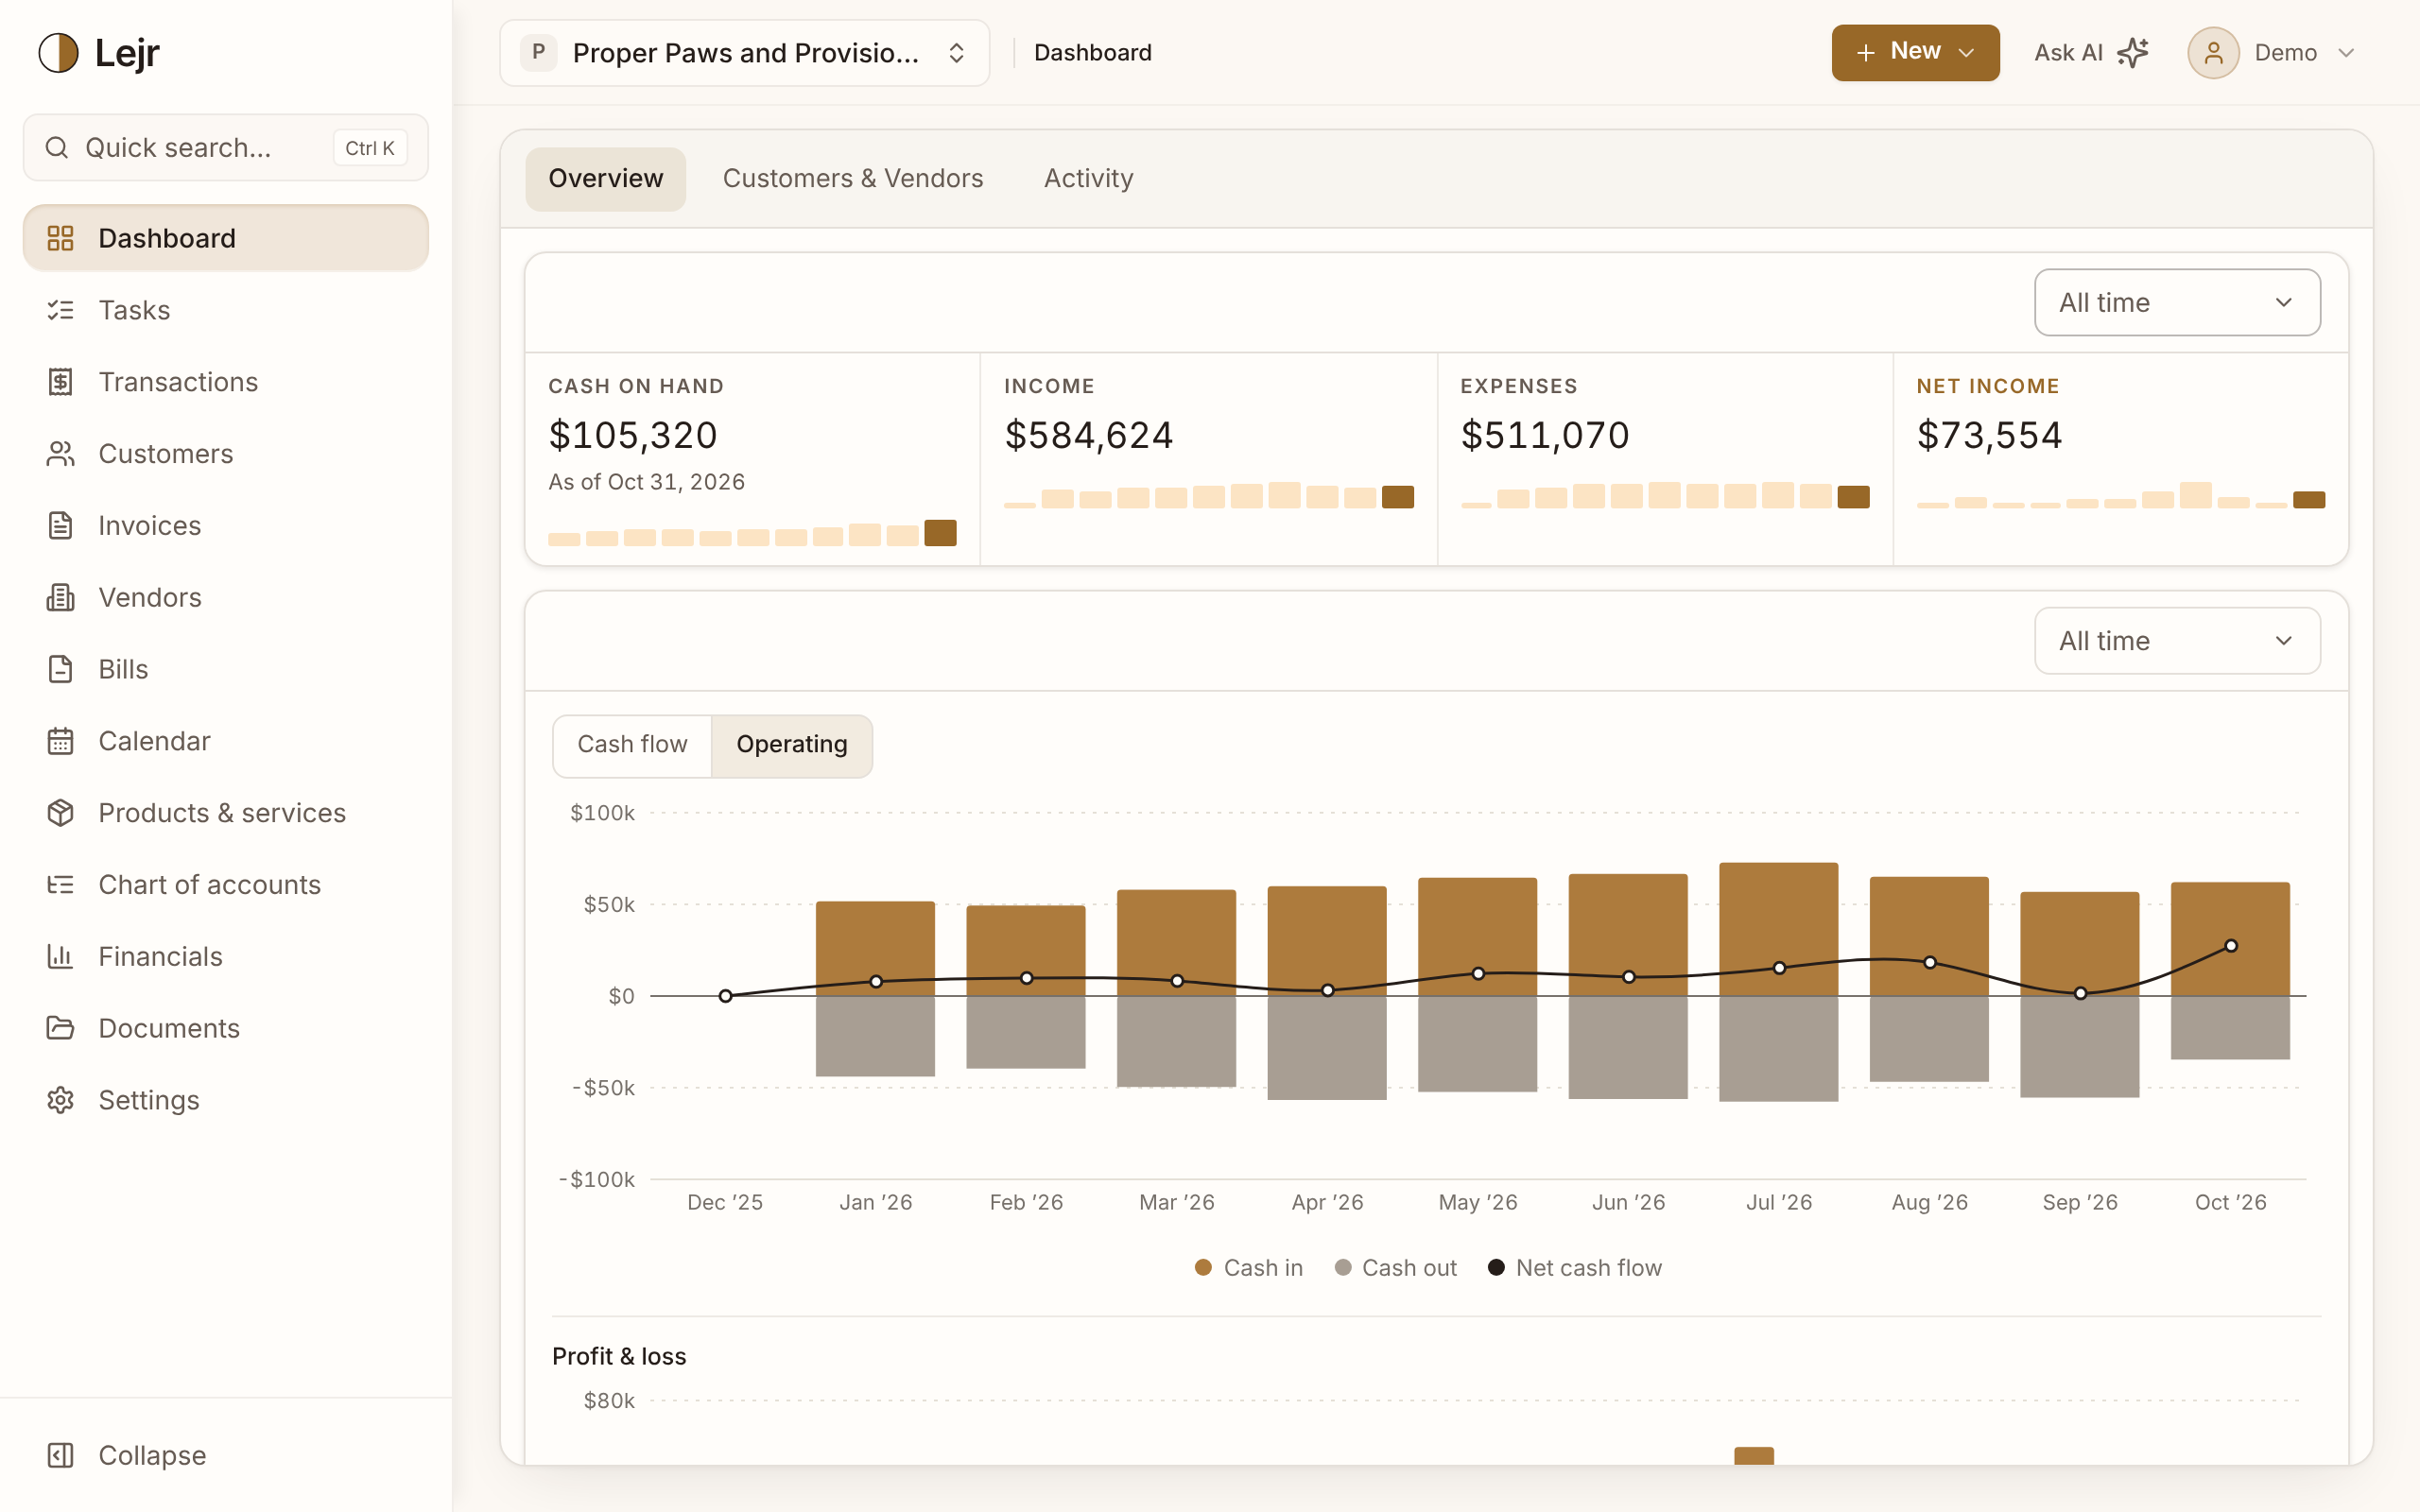
Overview shows Cash on hand, Income, Expenses and Net income, then cash-flow and profit-and-loss charts.
- Set each box's date range
Each box has its own range, defaulting to All time. Lejr remembers your choices.
- Switch tabs
Customers & Vendors shows your top customers and vendors, receivables and payables by age, and overdue invoices and bills. Activity lists recent changes to the books.
- Clear what needs attention
Each row in Needs attention links to the screen that resolves it. All tasks opens the full list.
Connected accounts
The box beside Needs attention lists each connected bank and card account with its balance and last sync, plus any AI connected to the business. With nothing connected, it offers Connect a bank.
Good to know
- Income, Expenses and Net income follow the business's accounting method, so they match the income statement.